RealClearPolicy Blog
Good News About Pension Bad News
The estimated underfunding of America’s state public-pension plans is larger than ever, with the American Legislative Exchange Council (ALEC) putting the total at $5.6 trillion or almost one-quarter of the federal deficit. But as disturbing as this number is — and as hard as it will be for legislatures and municipalities to dig out of their financial holes — the pension problem has some redeeming features.
Recent court decisions, for example, suggest that judges in California, Connecticut, and other states with low pension reserves are finally becoming skeptical of laws and practices that inflate post-retirement benefits or shield unproductive public employees.
This past August, a California Appeals Court rebuked a Marin County union for resisting the state’s effort to rein in so-called “spiking,” whereby pension benefits are based on overtime racked up in just the last few years of work. “While a public employee does have a ‘vested right’ to a pension,” Judge James Richman ruled, it is not “to the most optimal formula for calculating that pension.” Because California has traditionally set the pace in pension law, the Los Angeles Times predicts this decision will reverberate nationally.
A month later, Connecticut Superior Court Judge Thomas Moukawsher issued a surprise opinion in CCJEF v. Rell, an 11-year-old suit that sought increased subsidies for the worst performing schools in the state’s cities. Public employee unions, which had supported the case in the hope of salary increases, were shocked when the judge read his three-hour opinion. The real problem, he said, was not underspending but, rather, the lack of teacher accountability and the need for the Hartford legislature to demand better performance under the state’s existing $3 billion education budget. (Both decisions are now under appeal.)
A second result of the pension crisis is that citizens are finally awakening to the problem of government debt in general. For too many years, voters have regarded public deficits as a monetary abstraction with little impact on their own lives. But studies have begun to show the extent to which tax increases and bond referenda — supposedly intended to fix potholes, build parks, expand libraries, or provide some other public good — have been diverted to pensions.
According to an recent study by Josh McGee of the Manhattan Institute, average taxpayer contributions to cover teacher retirement benefits have risen from 12 percent in 2004 to 20 percent today, even while per pupil spending on equipment, facilities, and other instruction-related costs fell 26 percent. A similar report by Moody’s Investor Services has expressed concern that too much of the debt issued by public hospitals is really going to supplement underfunded staff pensions.
In Northern California, a series of editorials by East Bay Times warned San Francisco area voters that a $3.5 billion referendum to improve service on the Bay Area Rapid Transit (BART) subway system was designed to divert an already accumulated $1.2 billion capital fund to pensions. Although the referendum ultimately passed on November 8, a related transportation measure to increase sales taxes in BART’s Contra Costa region failed.
And in Michigan, where the state constitution places a limit on how much any municipality can raise from property taxes, the collective $2.3 billion unfunded liability of seven localities — Ann Arbor, Grand Rapids, Grand Traverse County, Kalamazoo, Lincoln Park, Port Huron, and Saginaw — means that residents of those areas will soon have to choose between salvaging public pensions and essential community services.
The third and perhaps most important benefit of the public-pension crisis is that it has not developed uniformly across the country. As the Center for Retirement Research at Boston College reported in its recent comparison of underfunded plans, the extent of the problem varies widely. States such as Florida, Iowa, and Nebraska, for example, have relatively modest liabilities compared to their revenue base.
What this means is that solving the problem of underfunded public pensions, while difficult and painful, will not likely lead to a federal takeover of the debt.
We have already seen how both parties in Congress balked at bailing out Puerto Rico’s $70 billion debt, most of which is due to the $43.2 billion unfunded liability of the Commonwealth’s two largest pension funds. Instead, a federal oversight board was appointed last summer to apportion financial responsibility among retired beneficiaries, bondholders, and local taxpayers.
Going forward, it is doubtful that even a very blue state such as New York, where Standard and Poor’s puts the per capita liability for underfunded pensions at only $74, will want to bail out either neighboring Connecticut or New Jersey, where the liabilities are $7,660 and $10,648, respectively. Only by giving as much money to states with solvent plans as it gave to those in the red could the federal government attempt a bailout — a solution that neither President-elect Trump (with his own spending priorities) or the Republican Congress are likely to endorse.
Sadly, it has taken a serious pension crisis to expose the fiscal dangers of the decades-old alliance between public-union leaders and the politicians who inflated worker pension benefits, resisted productivity improvements, and then failed to fund adequately the resulting obligations. But at least the worst consequences will be borne by those factions that should have been more fiscally responsible.
Dr. Andrews was executive director of the Yankee Institute for Public Policy from 1999 to 2009. He is the author of To Thine Own Self Be True: the Relationship between Spiritual Values and Emotional Health (Doubleday).
NLRB's Micro-Union Ruling Hurts Workers
Once upon a time, unions had to win elections fair and square to organize the workplace. And it required a majority of workers to form a collective bargaining unit. Today, though, thanks to the tools handed to Big Labor by the Obama Administration’s radical National Labor Relations Board (NLRB), workplaces across the country are bracing for a new type of union.
In 2011, the NLRB changed decades of longstanding labor laws in its decision on Specialty Healthcare and Rehabilitation Center of Mobile. In effect, the Specialty Healthcare ruling made it easier to unionize workplaces by allowing the creation of “micro-unions” — or the unionization of sub-units of a workforce — fundamentally changing the traditional bargaining unit standard that union elections operated under for decades.
What seemed like a game changer in labor law was downplayed by the NLRB, which initially assured employers and policymakers that the ruling would apply only to bargaining units in the non-acute health care setting, such as Specialty Healthcare, not industries outside it. In the years since, however, micro-unions — or what some call micro-units — have sprung up in nearly every industry, from retail, manufacturing, delivery services, and telecommunication to rental cars.
The NLRB may have underplayed its hand, but it knew exactly what it was doing.
The reality, as outlined in a recently released report by the U.S. Chamber of Commerce, is that unions are using the Specialty Healthcare ruling to gain influence in the workplace even if the majority of the workforce doesn’t want to unionize.
By grouping workers together in ad hoc ways, union bosses now have the ability — and, indeed, the federal government’s blessing — to cherry-pick individuals who are predisposed to support unionization, in turn increasing their odds of winning organizing elections and increasing membership. And that’s exactly what they’ve done. In the five years since Specialty Healthcare, several companies, including T-Mobile, Panera, and VW, have faced micro-union elections and successes.
Take Macy’s, for example. In May 2011, the United Food & Commercial Workers (UFCW) tried to unionize all 120 sales associates of the Macy’s department store in Saugus, Massachusetts. The majority of sales associated weren’t interested, and the UFCW lost.
The next year, however, the UFCW came back and filed a petition to represent the 41 cosmetics and fragrance sales associates within the same store. Using the precedent set by Specialty Healthcare, the UFCW was able to form a new bargaining unit and win, resulting in a micro-union comprised only of the store’s cosmetics and fragrance reps.
These carve-outs have been music to the ears of Big Labor, and the spread of micro-unions are on the rise. The Specialty Healthcare ruling suggests that the NLRB will approve just about any proposed bargaining unit a union throws its way — with little regard to how small, fragmented, or discordant.
This is exactly what the Board’s lone dissenter, Brian Hayes, warned against. In his dissent, Hayes recognized that the Specialty Healthcare decision represents a dramatic change in precedent. As he put it: “Today’s decision fundamentally changes the standard for determining whether a petitioned for unit is appropriate in any industry subject to the Board’s jurisdiction,” making “the relationship between petitioned-for unit employees and excluded coworkers irrelevant in all but the most exceptional circumstances.” In other words, it’s an outrageous re-characterization of the workforce.
Today’s employers are facing an assault from Big Labor like never before, and the NLRB is simply paving the way. This isn’t the first time the Board has downplayed a significant policy change with national ramifications; and, unfortunately, it probably won’t be the last.
The NLRB cannot be trusted to stand as an unbiased arbiter of disputes and champion of America’s workforce. From micro-unions to the joint employer standard to sped-up, so-called “ambush” elections, the Board has gotten completely out of control.
It’s time for Congress to stop talking and start acting by using the power of the purse to curtail the NLRB’s egregious overreach as well as passing legislation to overturn its anti-worker and anti-business rules.
Heather Greenaway is a spokesperson for the Workforce Fairness Institute (WFI).
Fighting Community Blight: Two Steps Forward, Two Steps Back
In the multi-front fight against blight in communities from coast to coast, encouraging signs of progress keep getting offset by steps backward. Recent developments in three states, in particular, display the full range of the spectrum in this fight.
On a positive note, a new fast-track foreclosure law in Ohio gives lenders the opportunity to foreclose and market a vacant and abandoned property while it is in somewhat good condition. New York, too, recently created an option for an expedited foreclosure process on bona fide vacant and abandoned properties that homeowners no longer want; unfortunately, the same law places a new burden on banks and servicers. Meanwhile, a disturbing court ruling in Washington state handcuffs those seeking to protect defaulted properties prior to foreclosure.
Antiquated foreclosure requirements in many states have allowed vacant and abandoned properties to sit empty for years. Ohio’s new law, which went into effect in late September, offers a model for other states to follow. It establishes a fast-track process for mortgage foreclosures on vacant and abandoned properties and includes a strict verification process to ensure that no one is forced from their home. As a result, the foreclosure process will now take as little as six months in certain situations. Just as importantly, the mortgage servicer can often take possession and be proactive in protecting the property so it doesn’t deteriorate to the point that it can’t be saved.
But it’s exactly this kind of pre-emptive protection that is now at risk in Washington state and could be in peril across the country.
In a ruling that could have far-reaching repercussions, the Supreme Court of Washington determined last July that state law prohibits lenders from taking possession of a property prior to foreclosure, despite any language to the contrary in the mortgage documents. Thus, changing the locks or otherwise securing an abandoned property is no longer permitted before foreclosure — even if the foreclosure process drags on for months or even years and the steadily deteriorating property becomes a target for vandals or squatters.
The ruling, which the mortgage holder in the case has asked the court to reconsider, applies only to properties in Washington state. Nevertheless, it sets a dangerous precedent that should send shivers up the spines of everyone who committed to fighting blight in communities across the country.
Following the Washington state court ruling, a federal class-action case will now move forward on behalf of some 3,600 borrowers in the state. The ruling and that class-action case could well embolden consumer activists to raise similar challenges in other states where standard language in mortgage documents could also be interpreted as being in conflict with state law.
Such challenges could pose a particular dilemma for banks and servicers in New York, where a new law imposes a pre-foreclosure duty on them to maintain vacant and abandoned properties. Aimed at preventing “zombie” properties and the spread of community blight, the law places the maintenance obligation — enforceable by a $500-per-day penalty — on a mortgagee when it becomes or should have become aware of the vacancy.
Meanwhile, the purse strings remain unnecessarily tight on the federal Hardest Hit Fund, which provides significant resources to 18 states and the District of Columbia and targets critical resources toward programs that help Americans avoid foreclosure and stabilize housing markets. Funds may be used for foreclosure avoidance programs and for demolition but, ironically, not explicitly to maintain vacant and abandoned properties. A House Committee Report containing language clarifying that it would be beneficial to do so remains bogged down in the government appropriations process for fiscal year 2017.
The idea behind fighting community blight isn’t to kick people out of their homes; rather, it is to prevent blight from spreading by securing — and, as a last resort, removing — vacant and abandoned homes. Those with an interest in preventing the spread of community blight —municipalities, lenders, mortgage servicers, community groups, and others — should unite to prevent further setbacks in these efforts.
Robert Klein is founder and chairman of Community Blight Solutions, which is focused on understanding, solving and eliminating the problems of communities experiencing blight.
Housing, Health, and Tax Programs Help Veterans
Veterans’ Day is an appropriate time to highlight programs that help many low-income veterans and military families make ends meet and consider how these programs can be improved. Policymakers’ actions in areas such as housing assistance, health coverage, and tax credits for working families affect thousands of veterans and their families in every state.
Since 2010, the number of homeless veterans has dropped by 47 percent. One key to this progress is the Housing Choice Vouchers program, which has aided tens of thousands of homeless veterans. Policymakers have funded these targeted vouchers since 2008 through the Department of Housing and Urban Development-Veterans Affairs Supportive Housing (HUD-VASH) program.
HUD-VASH pairs housing vouchers with supportive services — including mental health and other health care — administered by the Department of Veterans Affairs (VA). As the following graph shows, HUD-VASH has helped spur the rapid decline in veteran homelessness.
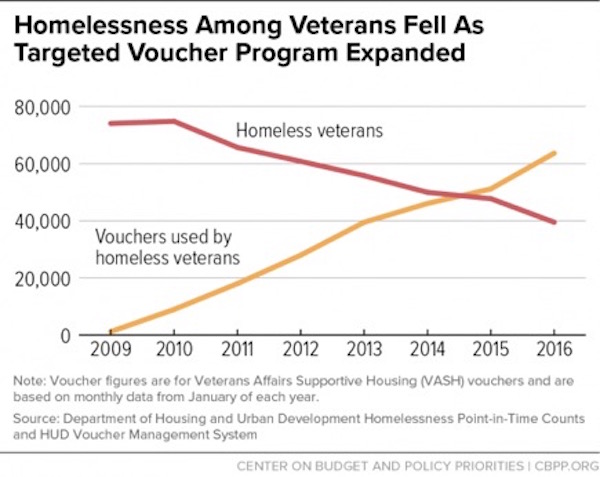
In addition to expanding HUD-VASH, policymakers have boosted VA funding for short-term homelessness-related assistance, and communities have targeted other housing resources on homeless veterans to help more of them get stable housing.
The success of HUD-VASH shows that targeted federal resources can drive down homelessness. Policymakers could do the same for other groups, such as families with children, by making a new commitment of Housing Choice Vouchers and other resources.
The HUD appropriations bill proposes $20 million for 2,500 new vouchers in 2017 for families and youth who lack stable housing and are involved in the foster care system. And President Obama’s 2017 budget includes 10,000 new vouchers for homeless families with children. Congress should include both proposals in the final HUD funding bill for 2017.
Significant numbers of veterans have recently gained health coverage, too, since the Affordable Care Act’s major coverage provisions took effect. Their uninsured rate dropped from 11.9 percent in 2013 to 6.8 percent in 2015, with the biggest gains coming in states that adopted the Medicaid expansion. In addition, the share of veterans reporting an unmet health need due to cost fell from 7.3 to 4.5 percent between 2013 and 2015, and the share reporting trouble paying medical bills fell from 16.3 to 14.9 percent.
States can do more to improve veterans’ health coverage. The Urban Institute projects that some 604,000 veterans will be uninsured in 2017. Most of the veterans without coverage are in the 19 states that haven’t yet expanded Medicaid. In non-expansion states, 39 percent of uninsured veterans qualify for Medicaid or health-care tax credits. By contrast, 70 percent of uninsured veterans in expansion states qualify.
Many uninsured veterans in non-expansion states are caught in a “coverage gap,” meaning incomes are too high for Medicaid but too low for marketplace tax credits. In North Carolina, for example, 49 percent of uninsured veterans fall into the coverage gap and would become eligible for Medicaid if their state expanded. In Florida and Georgia, 44 percent of uninsured veterans would become eligible for Medicaid if their state expanded; in Texas, 33 percent would.
Most veterans get health coverage through their employer, but for those without access to job-based coverage, large gaps exist. While some veterans receive coverage through the VA health system, some don’t qualify, don’t live near a VA facility, or aren’t aware of VA care. Coverage expansions have helped plug these gaps, but further health-coverage gains will depend largely on whether more states expand Medicaid.
Finally, the Earned Income Tax Credit (EITC) and the Child Tax Credit (CTC) — pro-work tax credits for low- and moderate-income working households — boost the economic security of millions of veteran and military households. Roughly 2 million veteran and military households earn the EITC, the low-income component of the CTC, or both.
The federal EITC and CTC together keep roughly 140,000 veteran and military households from falling below the poverty line and lessen the severity of poverty for another 420,000 such families. But workers who aren’t raising children in the home are eligible for little or no EITC — they’re the only group that the federal tax code actually taxes into poverty. Policymakers could strengthen the EITC for more than 600,000 veterans and active duty service members by expanding the credit for this group.
Jacob Kaufman-Waldron is a Communications Associate at the Center on Budget and Policy Priorities.
Infrastructure After the Wreckage of the Election
During election cycles, voters often have a difficult time holding candidates accountable for addressing consequential issues because politics and journalism as entertainment overwhelm true policy aspirations. Now that the most highly contentious election in a generation has ended, there may be an opening to address one such issue: sustained and vigorous infrastructure investment.
My firm commissioned a poll by Ipsos, a world class data analysis firm, to determine the impact of political discourse on accomplishing substantial change in infrastructure policy At first blush, the results are catastrophic for the infrastructure community — and the country.
The subject of infrastructure barely cracks the top 10 in terms of preeminent public concerns. While terrorism, perhaps rightfully, ranks at 37 percent, only 7 percent of respondents viewed infrastructure as a primary concern — behind morality (9 percent) and slightly ahead of the environment (6 percent).
This is a big problem. One veteran of the early Obama White House once told me: “If infrastructure is not a top three issue, then nothing will get done. There will be no oxygen for it.”
So how do we raise infrastructure investment above politics? There are powerful hints in the Ipsos poll that it could be elevated to a top national priority. Two concerns directly related to infrastructure polled very well: The economy was seen by 26 percent of respondents as the most important issue, while unemployment clocked in at 15 percent. Tying infrastructure to what it can achieve economically, and how it can meet our critical needs, will help create a much more compelling call to action.
Think of infrastructure outlays not in the ephemeral terms of our politics, but in terms of long-term investments for our country's success. In that sense, infrastructure is similar to an automobile engine: It’s true value lies in what it can move — in this case, the economy — and where it can take you: a better economic life, with more opportunities and meaningful high-paying jobs.
A dedicated team at my company spent the past year constructing a plan for the next administration to create a professional infrastructure system for our country. Titled Blueprint 2025, the project offers 19 specific policy recommendations based upon in-depth interviews with private and public sector thought leaders throughout the U.S.
Those probed identified three overarching obstacles to infrastructure action, and it is in the light of those challenges — and possibilities — that we can connect the dots for the next administration.
First, infrastructure is a long-term financial commitment, yet the government scores it as a static expense. So long as bureaucratic auditors characterize infrastructure as nothing other than a cost, there will be no reason to measure it against business growth, tax base incrementation, or the creation of quality career opportunities. Instead, we need to visualize and measure the benefits of infrastructure dynamically to reflect the additional economic activity and revenue that such investment generates.
Second, infrastructure is a first-level imperative, and the incoming administration needs to treat it as a clear and powerful priority. Is infrastructure only highways and bridges, as most people in the Ipsos poll believe? Or does it include power generation, clean and safe water, including in areas such as Flint, Michigan, wireless Internet connectivity, and the new projects of tomorrow such as driverless vehicles and the broader sharing economy? We need to define infrastructure to include all of the above and to understand the rewards of reimagined communities, a reenergized manufacturing base, and a reinvigorated trading strategy.
Third, and most critical, infrastructure is our roadmap to the future. It is a first-class consideration, but one that the government administers and budgets as a line item. The U.S. currently outlays only 1.3 percent of its Gross Domestic Product on infrastructure — an astounding 43 percent of what was spent on it at the beginning of the 1980s — and offers no dedicated budget and no cabinet level department to oversee it. That must change.
To elevate infrastructure to a top priority for Americans, we need to make clear its importance for economic growth and long-term job creation — issues that transcend election cycles. Then we will be in a position to build the kind of policy and institutional support that will generate 3 to 4 percent GDP growth, renewed export success, and a rejuvenated U.S. infrastructure presence throughout the world.
We cannot afford to hold infrastructure decisions hostage to political cycles. It damages our ability to imagine, invest in, and help create that prosperous future that remains among the highest and most cherished priorities of our voters.
Norman F. Anderson is the President and CEO of CG/LA Infrastructure, a nonpartisan global consulting firm based in Washington, D.C. and a member of the World Economic Forum’s Global Agenda Council on Infrastructure. Twitter handle: @anderson_norman
The Government May Be Allowed to Ban Books and Movies
Believe it or not, this election will determine whether political appointees can prohibit books and movies released during election years that criticize their policies or behavior.
It’s well known that Citizens United v. Federal Election Commission concerns the role of money in politics, but it’s less often remarked that the decision centered around a 2008 film called “Hillary: The Movie,” a documentary critical of Mrs. Clinton. Arguing against Citizens United, a conservative non-profit, the Federal Election Commission made the case that because a film, such as “Hillary: The Movie,” was produced or distributed by a corporation (as are all commercial documentaries), it could be prohibited by the government. At oral argument, they went so far as to argue that such a ban could extend to books, pamphlets, and Internet sites produced or distributed by corporations. Fortunately, the Supreme Court said no. Unfortunately, four justices dissented from that common sense First Amendment ruling.
No, Bad Trade Deals Aren't Good for America
In what has become now a standard page out of the tired Clinton playbook, the Clinton campaign has released a letter from over 300 pro-offshoring economists denouncing Donald Trump. This appears to be a belated Hail Mary response to a September 26th letter from over 300 economists insisting “Hillary Clinton’s economic agenda is wrong for America.”
A close look at this later indicates a clear case of the dog that didn’t bark. The letter was very careful not to support Hillary Clinton’s economic plan, and it’s no secret why.
Trump's Right: It's Time to Turn Our Inner Cities Around
Donald J. Trump is known for his hyperbole. He often says, for instance, that “China is killing us.” Things he likes are “huge,” while anything amiss is a “disaster.”
In the final presidential debate, he told the audience something similar: “Our inner cities are a disaster.” And last Wednesday in Charlotte, North Carolina, Trump delivered a speech, pitched at urban voters, in which he echoed that sentiment, asserting that “the conditions in our inner cities today are unacceptable.”
But what if Trump’s right? And what if we declared — under federal law — the crime, urban blight, and economic malaise affecting our urban cores what it really is: a disaster.
In his speech, Trump proposed just that, saying: “I will further empower cities and states to seek a federal disaster designation for blighted communities in order to initiate the rebuilding of vital infrastructure, the demolition of abandoned properties, and the increased presence of law enforcement.” The idea did not make headlines, but it should have. It’s radical, revolutionary, and just what urban America needs — a federal disaster declaration for our most impoverished, hard-hit neighborhoods.
Under current law, when the president declares an area to be a disaster, additional federal assistance can be applied, while regulations and rules for rebuilding and revitalizing the affected area are often waived or reduced.
Under the model established after the I-35W bridge collapse over the Mississippi River, federal authorities can streamline infrastructure and other projects that often take a decade from start to finish. The Minnesota bridge was rebuilt better than ever in 437 days, with only 100 days required for planning and review. Compare that to the average of seven to eight years on most federal infrastructure projects.
Federal lawmakers took the lessons of that project — as well as the crawling pace of the post-Katrina response — to heart after Super Storm Sandy, ordering FEMA to streamline the process for aid.
Urban “HOPE zones” — as Trump’s proposal could more aptly be termed — would enable individuals and businesses to apply more quickly for revitalization aid, including home improvement and personal loans. Most especially, they could also apply more quickly for start-up capital available from the Small Business Administration.
That’s where Trump’s second, but equally radical, proposal comes in: microloans in lieu of social-assistance payments. To take an obvious example, unemployment payments could be turned into repayable but forgivable loans, according to Trump.
Will Flight Regulations Keep America on the Ground?
Racecar driver Mario Andretti once said about racing, “If you’re in control, you are not going fast enough.” In the 20th century, government saw its role as control, but today’s realities demand faster decisions that keep pace with our economic and strategic competitors.
Nowhere is this more evident than in aerospace.
We are on the verge of personal aircraft that can take off and land in a large backyard and can be flown autonomously. Drones, which a few years ago were non-existent, are now being developed and used for many applications in our national defense and economic life. Airplanes that can fly at hypersonic speeds and deliver passengers to locations thousands of miles away in only a couple of hours are now being designed. Spacecraft are being built and tested that will take average citizens to earth orbit within a decade. New propulsion systems are being created that will allow aircraft to fly faster or, in some cases, fly using only solar power. Autonomous air freighters are being envisioned that will permit vast movement of tons of cargo without the need for pilots.
And this is just the beginning. When engineers and visionaries look to the sky, they see limitless potential for economic growth, new product development, and technological achievement that will define our future.
Unfortunately, all of these technologies must win the approval of federal regulators. And like all such regulation, our systems for managing aerospace rely on layers of bureaucracy and stakeholders — which are inherently slow and unable to keep up with technological progress. We live in an era of exponential change in technology, and government is far behind the curve — perhaps by decades.
On aerospace, in particular, you can’t say we weren’t warned. All the way back in 2002, the Commission on the Future of the United States Aerospace Industry foresaw most of the breakthroughs that are rapidly becoming available today. Indeed, the predictions of the Commission hold up remarkably well 14 years later.
Unfortunately, one of the predictions that holds up best is the failure of the old air traffic-control system to enable technological progress, rather than block it. As the Commission put it:
“Our current air transportation system is severely limited in its ability to accommodate America’s growing need for mobility. The basic system architecture, operational rules and certification processes developed several decades ago do not allow today’s technologies to be fully utilized and do not allow needed innovations to be rapidly implemented.”
What was true 14 years ago is still true today. And the situation has grown more dire because emerging technologies are complicating the system’s ability to cope.
The main recommendation made by the Commission was for “rapid deployment of a new, highly automated air traffic management system so robust that it will efficiently, safely, and securely accommodate an evolving variety and growing number of aerospace vehicles and civil and military operations.” Within a few months of the commission’s recommendation, the Federal Aviation Administration, working with NASA, established the NextGen project aimed at creating the new air traffic management system.
A decade later, however, the system is still under development. Despite some progress, it is still years away from full implementation. Meanwhile, technology and demand has already advanced beyond the design and structure of the “new” system.
The recent drone rulemaking from the Federal Aviation Administration is a good example of the costs of this failure to modernize. Much of the potential that drones hold — from delivering packages to reducing traffic congestion on our roads — was foreclosed by the need to fit drones into a system that never envisioned remotely piloted aircraft and autonomous aircraft interacting with other air traffic. However, had the automated air traffic network recommended 14 years ago been deployed in time, it would have been much easier to accommodate drones and their potential would not have been needlessly limited.
The opportunity cost of failing to adapt government to the modern world will only increase with time. Imagine the freedom of mobility offered by a personal aircraft that could take off vertically from your driveway, fly hundreds of miles without your touching the controls, and deliver you safely to a destination of your choice. The technology to make this vision a reality is already in advanced development. But the government-run system for managing this new wave of new technology is not yet in place.
The choice is clear: Either transform government or miss out on economic horizons of almost unimaginable proportions. In aerospace, at least, the sky isn’t the limit — bureaucracy is.
Newt Gingrich is the former Speaker of the House. Former Congressman Bob Walker (R-Pa.) is the Executive Chairman of Wexler/Walker.
An "Inverse Prop 8" For California?
When asked what made him great, hockey legend Wayne Gretzky replied, “I skate to where the puck is going to be, not where it’s been.” Of course, it is necessary to know where that hard rubber disk is moving. It’s not enough to look ahead, but to look in the right direction, and act.
As contentious as any measure this past session, the California Legislature passed and Governor Brown recently signed Senate Bill 1146, written by State Senator Ricardo Lara (D–Bell Gardens). The original premise of the bill was to equalize the treatment of same-sex married and transgendered students, faculty, and staff in the use of facilities on private, religious California colleges and universities who admitted students using state educational grants. The bill was amended before final passage to require certain disclosures related to the religiously-based policies for these private universities.
In the bill’s previous versions, if a California college offered married campus housing to heterosexual students or staff, they would have to do the same for same-sex married couples. Similarly, if faith-based colleges with on-campus chapels offered them to heterosexual couples for wedding services, they’d have to do the same for same-sex couples — no matter what the religious principles of the institution.
At first glance, the original bill appears to be a logical next step in policy-making as we enter a “Post-Obergefell World” — referencing the Supreme Court decision making same-sex marriage a right.
Clashing with this new right is the foundational constitutional First Amendment right of religious freedom. On a federal level, churches and faith-affiliated institutions have received Title IX exemptions for their hiring and access policies that are demonstrably consistent with their long-standing teachings. For many faith-based organizations, there can hardly be a longer-standing tradition of considering marriage the joining of one woman and one man.
For his part, Senator Lara appeared to discount the legitimacy and sincerity of the Religion clauses. In announcing his motivation behind writing SB 1146, the senator declared, “universities should not be able to use faith as an excuse to discriminate.” The statement raises disturbing questions for people of faith in California.
First, regarding Senator Lara’s assertion, is religion an “excuse to discriminate” or a reason to discriminate? While the world’s great religions invite all prospective adherents, they at some point offer a choice to step into affiliation that is inherently discriminatory in what is asked only of its members. Like that old American Express tagline, “Membership has its privileges,” but particularly for people of faith, it also has its commitments.
This right to “freedom of religion” and related faith-inspired obligations have provided the basis for the world’s most deferential civil society in terms of protection of religious association. From soup kitchens to parish schools, from hospitals to adoption agencies, America has — and protected the rights of — religiously-affiliated groups and institutions.
The second question is the “Gretzky Question”: If millennia-old religious tenets practiced by California faith-based colleges and universities are merely “excuses for discrimination,” then where is this puck going? Will California’s many Catholic hospitals be ordered to provide abortifacients or abortions, or otherwise face closure for discriminating on the basis of sex? Will Catholic or Christian schools be ordered to extol same-sex marriage in their curriculum even if it violates the tenets of their faith?
As two concerned Californians of faith, we propose here a genuinely California solution — one that is in keeping with our state’s progressive culture, our long-standing support of faith-based organizations, specifically, and the freedom to associate, more broadly.
In light of the Obergefell ruling, states from Georgia to Utah have wrestled over the development of their own RFRAs (Religious Freedom and Restoration Acts), but by permitting individuals to discriminate — especially in the private sector — those measures provoked business community lobbying against them, citing legitimate concerns about creating discriminatory business climates.
Rather than a state RFRA, we propose an amendment to the California State Constitution that would guarantee the rights of churches and faith-based organizations to continue practicing their long-held beliefs, so long as the organization meets the Federal Title IX requirements for exemption as a religiously-affiliated organization. Doubtful that our state legislature would take up this measure, we further propose that it be considered in a genuinely California way — through the initiative process.
In effect, we are suggesting an “Inverse Prop 8” — one that seeks to protect all people of faith as they practice their beliefs in the most important way: caring for those in need, doing good works, and providing guidance in meeting life’s challenges through the principles of their faith tradition.
Copyright on the Campaign Trail
At this point in the election cycle, the discussion about who will be elected as our next president dominates the 24-hour news cycle, water cooler conversations, and our social media feeds. As political campaigns create videos, news clips, advertisements, and other content to inform and influence the outcome of the election, they are coming into contact with an important part of our nation’s copyright law: fair use.
First amendment protections are embodied in fair use, which allows everyone to use existing scientific and cultural material without permission, under certain circumstances. To determine if a particular use is “fair," four factors are applied: 1) the purpose and character of use; 2) the nature of the work; 3) the amount and substantiality of the portion taken; and 4) the effect of the use on the market for the original.
Campaigns at all levels — from the presidential race to state and local races — depend on this important legal doctrine to perform their daily activities, including everything from posting on Facebook to livestreaming a town hall to criticizing opponents. Fair use comes into play when producing TV, digital, print, and radio ads. A campaign might also produce an attack ad to highlight the opponent flip-flopping on tax increases during a TV interview. In that case, the interview is copyrighted, but fair use allows a short clip of the full interview to be used legally.
Another example is livestreaming. Livestreaming a candidate’s speech on Facebook Live, for instance, is permissible under fair use. Without it, the livestream would be an unlicensed use of the written speech, which is a protected work. Even popular “Saturday Night Live” skits spoofing campaign ads rely on fair use protections.
The infographic below helps break down the concept of fair use by illustrating how much political campaigns rely on it. Not only campaigns: When voters post and share videos, excerpts from news stories, SNL clips, as a way to engage in discussions about candidates and the election, they too benefit from fair use protections.

Josh Lamel is a copyright lawyer and Executive Director of the Re:Create Coalition.
Don't Run the Government Like a Business
“Why can’t the government be run more like a business?” It’s a common refrain. Politicians and pundits often bemoan the government’s lack of efficiency, its rampant waste, and its bureaucratic bloat. Some tout experience in private-sector business management when hawking the credentials of favored candidates for political office — whether Mitt Romney in the past or, more disturbingly, Donald Trump today. It is almost an article of faith, for some, that business-minded folks possess a magic formula to cure the dysfunction of government administration.
The Department of Defense is no exception when it comes to praise of managerial acumen or the need to adopt business practices. In recent testimony before the Senate Armed Services Committee on defense reform, more than one expert declared the need to emulate business practices or loosen the rules regarding private sector executives serving at the department. But there are two interrelated problems with these admonitions to run the Pentagon, in particular, and the U.S. government, in general, like a business. First, and most obviously, the government is not a business. Second, the Department of Defense is already run like a business — and that’s the culprit behind its chronic dysfunction.
Let’s tackle the second problem first. The Pentagon has been managed according to principles from private-sector business since at least the early 1960s. The “McNamara Revolution” at the Pentagon was supposed to bring private-sector managerial techniques to the defense bureaucracy. Secretary of Defense Robert McNamara had worked at Ford Motor Company, where his application of statistical analysis to automobile production helped rescue the auto giant’s struggling sales. In 1960, McNamara was named president of the company — the first non-Ford to hold the position since its earliest days. But his tenure was short-lived. In 1961, newly elected President John F. Kennedy asked McNamara to serve as secretary of defense in the hopes that he would apply the managerial techniques he used at Ford to the management of the U.S. military.
The centerpiece of McNamara’s managerial revolution remains largely in place at the Department of Defense today. The Planning, Programming, and Budgeting System (PPBS) installed at the Pentagon in the early 1960s was similar to the planning system McNamara used at Ford to streamline production. In regard to defense planning, PPBS created mission packages around which different programs would be built, comparing them to determine which could fulfill the mission most efficiently.
One of McNamara’s successors, Donald Rumsfeld — in his second stint as secretary of defense, and after spending time as a private sector executive himself — modified the system only slightly. In 2003, PPBS became Planning, Programming, Budgeting, and Execution (PPBE). Rumsfeld believed that greater emphasis needed to be placed on the performance of Pentagon programs. Instead of just comparing system inputs for efficiency, PPBE would use “output measures” to judge how programs perform, with adjustments made following an “execution review.”
But the real problem with PPBS was not that execution had been ignored; it was that defense as a government activity is not comparable to the production of cars. While the latter has a verifiable output against which competing production techniques can be assessed to determine which provides greater efficiency, the former does not. The U.S. military is what political scientist James Q. Wilson called a “procedural” organization. The activities of these organizations do not lend themselves to efficiency measurements because the relationship of resource inputs to organizational outputs is often unclear. This is particularly the case during peacetime when a military’s primary organizational output, success in combat, is unavailable.
Yet, even in the private sector, where outputs can be measured against efficiency, formal planning systems still fail. As management scholar Henry Mintzberg explains, PPBS and similar planning models suffer from what he calls the three fallacies of planning: (1) the “fallacy of predetermination,” which assumes that the future operating environment will comply with previously made plans; (2) the “fallacy of detachment,” which assumes that strategic formulation and implementation can be divorced from one another; and (3) the “fallacy of formalization,” which assumes that procedure can replace judgment when making strategy.
But, as Mintzberg argues, the future environment rarely conforms to forecasts; formulation and implementation of plans are necessarily intertwined; and overemphasis on formal procedure eliminates creativity. These three fallacies were exposed in the turbulent economic environment of the 1970s. In a 2010 essay on defense planning that drew on Mintzberg’s work, political scientist Ionut Popescu explains that while successful firms moved away from formal planning systems and eventually abandoned them altogether, the Pentagon soldiered on under the discredited approach.
The fact that the private sector moved away from the very systems criticized by Mintzberg illustrates the fundamental problem with trying to run the government like a business. Market feedback induced some firms to adjust to the new circumstances. Those who could adjust weathered the storm; those who could not, failed. Such organizational failures are a part of life in the private sector. Over the 12 months ending in June 2016, more than 25,000 businesses filed for bankruptcy — down from more than 59,000 over a similar period ending in June 2010. The Department of Defense is a different animal. It is difficult enough to cancel individual defense programs. It is almost inconceivable that Congress would allow an entire military service to go “out of business” should it fail to perform efficiently.
Even if market feedback were available, government bureaucracies like the Department of Defense could not respond the same way private businesses did. When facing trouble, successful firms reallocate funds, reduce overhead, use past profits to make new investments, and adopt new managerial practices. As Wilson explained, the political constraints under which government bureaucracies operate do not allow that. The Department of Defense can rarely reallocate funds without congressional approval. Political interests actively obstruct attempts to reduce departmental overhead. The military has no profits of its own to reinvest. And even when it wants to adopt new practices, the Pentagon often requires legislative authorization to do so.
As the Senate Armed Services Committee explores reforming the Goldwater-Nichols Department of Defense Reorganization Act of 1986, and as Secretary of Defense Ashton Carter encourages the U.S. military to follow Silicon Valley’s lead and be more innovative, we need to be cognizant of what separates an organization like the Pentagon from private businesses. There are few ways to capture market feedback in defense management, and the ability to respond to it is constrained by the political process.
Leveraging competition between the military services might generate market-like signals for the distribution of resources, and allowing the bureaucracy to allocate resources in response to those signals might lead to more efficient practices. However, expecting a mammoth bureaucracy to mimic private sector practices — absent the mechanisms that make the private sector work — will only lead to further dysfunction.
This is not to say that business practices have no place in defense management, nor is it a call to bar businessmen from the Pentagon (or the government more generally). However, the success or failure of those practices — or of the individuals who implement them — is dependent on understanding the nature of the enterprise in question. Government bureaucracies are not businesses. They face different constraints and generally lack the market feedback needed to know which practices work and which don’t.
It is entirely possible that individuals with business and managerial experience can bring new insights to defense management. It is highly unlikely that they possess any magic formula for overcoming the basic realities of bureaucratic life with which defense management must necessarily contend.
New Transportation Regulation Will Weaken Local Power
You have probably never heard of Metropolitan Planning Organizations (MPOs). But they are some of the few remaining bastions of local power left in the United States. Created by the Federal-Aid Highway Act of 1962, MPOs exist in all sizable urban areas and give local governments control over how federal transportation funds are spent. They ensure that each town and city gets a say on upcoming projects, ensuring that a super-highway, for instance, isn’t run through your backyard just because the federal government or the state governor says so. MPOs provide checks and balances to more centralized state and federal control.
That is, until now.
A new regulation proposed by the Obama administration’s Department of Transportation seeks to merge any MPOs whose urbanized areas share a boundary into one, large MPO. For a city in central Iowa, with few connected urban areas, this might not be a big deal. But for the northeast corridor, this is huge. The densely packed tri-state area would be fused into an organization that could dictate where and how federal transportation funds are spent. This merger would happen in two steps, in 2018 and 2022 respectively.
The implications are clear. Where do you think New York City will want to spend federal transportation dollars? Probably not Stamford, Connecticut, and most certainly not Hartford, Connecticut or Springfield, Massachusetts, all of whom would be affected by this change in policy. This restructuring would ensure that major metropolitan areas such as New York City and Boston would have the power both to approve and to veto projects in towns in other states. It would form an isolated bureaucracy that will control a massive amount of federal dollars.
Moreover, this will happen not just in the northeast but throughout the nation. Any urbanized area which touches another would be fused into one MPO, creating a domino effect in smaller states or areas where several urban zones are near one another.
Current MPOs in Connecticut

The regulation proposal was released just before the 4th of July weekend and is set to take effect in October. The timing is suspicious. Many MPOs don’t meet during the summer months and Congress is out of session then. Meanwhile, the regulation proposal allowed only a 60-day comment period, rather than the usual 180 days. The comment period ended on August 26th, before Congress came back into session. “We have this thing being done fast and at a strange time of year,” according to Francis Pickering, Executive Director of the Western Connecticut Council of Governments. The U.S. Department of Transportation recently offered a 30-day extension of the comment period thanks to protests from MPOs across the country.
2018 regulations

At the end of May 2016, MPOs across the nation finished a two-year collaborative rule-making process that developed new regulations for MPOs. “One month later, the proposed rule comes out of the blue,” Pickering said. “It’s not consistent with, and is not covered by, the rule-making that just ended in May.”
Accordingly, the state of Florida, which has 26 MPOs, issued a strong rebuke to the proposed regulation, citing President Bill Clinton’s 1999 Executive Order 13132 regarding federalism. According to section six of the order regarding consultation, “Each agency shall have an accountable process to ensure meaningful and timely input by State and local officials in the development of regulatory policies that have federalism implications.”
Potential outcome of 2020 changes

According to a statement issued by the Florida Department of Transportation: “Simply put, FDOT does not believe that the Consultation requirements of Executive Order 13132 have been met.” They go on to state that “the foundation for rule making (and for any other federal-state-local policy or program) must be an understanding and application of federalism principles to ensure that our intergovernmental relationship is as effective and efficient as possible.”
Secretary of Transportation Anthony Foxx served as mayor of Charlotte, North Carolina and chair of the local MPO. Foxx was frustrated with the process of planning transportation projects and has “made no secret of his desire to see MPO consolidation,” according to Alexander Bond, director of the Center for Transportation Leadership. Although he pushed for the merging of the MPOs in the Charlotte region, his efforts as mayor did not pan out. But while Secretary Foxx failed in Charlotte, he may succeed nationally through these new regulations.
Connecticut is the only state to have successfully and voluntarily merged MPOs — a process that took four years and $1.7 million, according to Sam Gold, executive director of the River Council of Governments in Connecticut, who was directly involved with the merger. “It was a very expensive project,” Gold said. One can only imagine what the costs would be in trying to merge every MPO from Massachusetts to Washington, D.C. No one from the Department of Transportation even reached out to the Connecticut MPOs to discuss what these mergers might entail.
One does not need much imagination to picture what this new plan will look like. First and foremost, it will weaken one of the last vestiges of local power and control over how federal dollars are spent. Decisions regarding building roads or bridges in Connecticut or fixing rail-lines in New Jersey would all have to be approved by a central commission in New York City.
Secondly, since transportation encompasses a myriad of different issues — including pollution, land use, housing, and energy — it stands to reason that this big metropolitan conglomerate will be able to impose restrictions and regulations that force local towns and cities to conform to the MPO’s wishes or else risk losing transportation funding. The new Mega-MPO will hold both the carrot and the stick, having both the power of the purse over state and local planning and the power of regulation over what cities and towns can do with their federal funds.
“The politics that we deal with here are not necessarily Republican versus Democrat, its local versus state, local versus Feds. It’s really about levels of government and separation of powers as opposed to parties,” Gold said.
That kind of politics has become all too rare.
Regulators Set Their Sights On an Internet Industry
Perhaps the most important currency in the Internet age is our personal information. We constantly provide information about ourselves to content providers in exchange for the services we use. We use social media, e-mail, and web-search tools for free because we allow companies such as Microsoft, Yahoo, Google, Facebook, and Twitter to use our personal information.
But bureaucrats at the Federal Communications Commission are currently considering a proposal that would heavily regulate our ability to trade information on the Internet. What’s more, the regulations would only apply some companies, putting them on unequal footing with their rivals and creating an inefficient and unfair marketplace.
The FCC’s reclassification of Internet service providers (ISPs) as telecommunications services in 2015 has opened the door for a very broad swathe of unilateral regulatory moves by the FCC, including their new information proposal. Under this proposed framework, there would be a heavy regulatory burden for ISPs — such as Comcast, AT&T, and Verizon — that would not apply to other companies that similarly trade personal information for communications services.
There are legitimate concerns at the heart of this matter. Americans are very worried about their privacy online, especially how much control they have over their own information. But a few key facts cloud the FCC’s proposal.
First, Americans’ concerns about their personal information are not, in fact, growing. We live in an unprecedented age of information sharing: Americans are giving out more and more of their information online, on social websites, shopping websites, and search engines, while giving those companies the ability to tailor their web experiences and advertising based on that information. But — perhaps surprisingly — since the turn of the century, Americans’ concerns about their online privacy have not actually increased. While privacy remains an important American value, the level of concern among the public is roughly the same as in the year 2000, despite an overwhelming increase in the flow of information.
Second, people don’t trust the government with their information, either. In fact, the Pew Research Center has found that people don’t trust the government any more than they trust their cell phone companies or third-party websites with information security. (Nor is it clear that Americans trust ISPs any less than giant communications corporations such as Facebook or Google.)
Third, while the FCC claims that the regulations are intended to bring a universal standard to privacy and information security online, that’s impossible by definition. Why? Precisely because the FCC doesn’t have authority to regulate companies that aren’t classified as ISPs (such as Facebook or Google). In reality, the FCC is simply trying to exert regulatory control over the only companies it has power over: common carrier telecommunications companies.
This selective regulatory approach will result in a two-tiered regulatory regime in which consumers are left in the dark about who is allowed to do what. And it will the disproportionately empower content corporations, such as Facebook and Google.
To create genuinely universal standards, Congress would have to pass new laws. And that’s how it should be: Accountable politicians with the power to create law — rather than the unelected bureaucrats at the FCC — should be the ones proposing any necessary regulations.
There’s good reason for Americans not to trust the FCC with the kind of power they’re trying to exert. The FCC has been anything but transparent during this process: There have been thousands of comments made to the FCC during the comment period that have not been made public, counter to the FCC’s standard procedure. Given that track record on transparency, it makes sense to be skeptical about the FCC’s claims that its privacy standards will benefit consumers.
New Rules for Self-Driving Cars Aim to Fix What Ain't Broke
The folks at the National Highway Transportation Safety Administration (NHTSA) are a lot like other regulators: When they see that a given power exists, they covet it.
Charged with developing standards for self-driving cars, NHTSA this week published a set of nonbinding guidelines for the embryonic industry that, to be fair, are mostly commendable as an exercise in regulatory restraint. But buried in the 116-page proposal are ideas that, if enacted, would require a massive expansion in the role the federal government plays in the development of new automotive technologies.
Luckily, for this authority to be realized, Congress would need to grant its approval. If we’re fortunate, Congress will do no such thing.
Tagged with the seemingly inoffensive moniker of “pre-market approval,” the NHTSA pitch would grant the agency a regulatory veto over almost any new self-driving technology. The impact would be enormous, subjecting innovators to unprecedented and unnecessary scrutiny, in addition to a drawn-out process of regulatory delays.
The guidelines contemplate two different paths to grant the agency pre-market approval authority. Under the first, NHTSA could prohibit a manufacturer from introducing any highly automated vehicle without first obtaining federal approval. Under this system, any new technology would be presumed forbidden unless or until granted express permission. Moreover, the guidelines note that this system would require a “large increase in agency resources.”
The second path is at least somewhat more reasonable. It proposes a system of “hybrid certification,” under which the federal government would grant an initial blessing to technologies that would be self-certified later by vehicle manufacturers. While less invasive, this idea still fails to overcome the basic problem of forcing delays in a fast-moving new industry in which virtually all meaningful advancements will be novel. The big danger is that such delays could lead to the rise and deployment of inferior technology, simply by virtue of happenstance.
For those lawmakers who embrace free markets and limited government, opposing both visions of pre-market approval is a no-brainer. Adding red tape to the process by which vehicles are brought to market will only increase consumer costs and chill development of these exciting technologies.
For other lawmakers, including those concerned about the readiness of autonomous-vehicle technology, the proposals might be more difficult to dismiss. NHTSA’s case for pre-market approval authority is modeled on other federal bodies that currently wield similar authority. In particular, the agency cites the Federal Aviation Administration, which uses pre-market approval in its evaluation of autopilot and other aviation systems.
Whether the FAA’s system, itself, is ideal is a separate question and worthy of exploration. What’s more pressing is to make clear that there is no good reason for NHTSA to abandon its current system of self-certification. Under that system, the agency uses a risk-based selection process to test a sample of vehicles and standards. Though imperfect, this approach has been proven to strike an effective balance between consumer protection and market flexibility.
Similar to how insurance companies evaluate risk, the self-certification system balances the potential severity of a hazard with how often it is expected to be a problem. On that basis, NHTSA targets the products of greatest concern. And, by its own admission, NHTSA notes that, historically, “instances of non-compliance, especially non-compliance having substantial safety implications, are rare” under its current approach. Unless NHTSA can demonstrate that highly automated vehicles require a substantially more onerous method of scrutiny, there’s simply no reason to move away from a system that, since passage of the National Traffic and Motor Vehicle Safety Act in 1966, has proven an effective regulatory tool.
When It Comes to Housing, Your Voucher Is Your Stigma
“Your money is no good here.” That’s the message regularly communicated to families with verifiable, legal payment seeking rental housing in cities across the country.
Legally, no landlord in the U.S. can turn away a prospective tenant because of race, color, national origin, religion, disability, or children in the household (except in a handful of circumstances, such as the “Mrs. Murphy” exemption). Some states and municipalities even have their own housing ordinances barring discrimination based on a handful of other characteristics such as age or sexual orientation. Why, then, are so many families with rent money in hand being blocked from housing?
The answer is that in almost every city in 42 states, it’s legal for landlords to turn you away if you use housing vouchers.
In a country that proclaims a love of freedom, grit, and determination, the Housing Choice Voucher Program (often referred to as “Section 8”) is something we should be proud of. Housing vouchers mean that folks bringing home peanuts for paychecks can rent decent, safe places to live. Moreover, unlike public housing, a voucher means you choose on the private market the neighborhood and apartment that you determine will make a good home for you and your family. In other words, Housing Choice vouchers allow you to navigate the search for suitable housing with dignity, even if your paycheck is small.
That’s the idea, anyway. In reality, your voucher is your stigma.
Let’s say you’re one of the lucky families whose name gets picked from a voucher waiting list after years of scraping by with no housing assistance. Suddenly, you see a whole new future: You imagine picking out the right place to live. You know it will probably be small, maybe a little cramped as the kids grow, but all the light switches and faucets will work, the refrigerator will stay cold, the stove will turn on, and the doors will have locks. The neighborhood will be safe, with good schools that you wouldn’t be able to afford without the help of the voucher no matter how many extra shifts you pulled at your hourly, minimum-wage job. What’s more, you’ll have a regular place for your kids to sleep, play, do homework, and bring friends over — where you can kick your shoes off and decompress for a few minutes after work, before getting back up to make sure everyone has dinner, baths, and something to wear to school tomorrow. While not perfect, your new place will be a home where you can invite family over for holidays and birthdays, turn up the music on a hot summer evening, and laugh and argue and celebrate and cry and do all the things that families do.
It may be hard — really hard — to make ends meet every month, since the voucher only pays for a portion of the rent and doesn’t help with the utilities. But you’ll know that you’re making a better life for your kids, that they’ll become better educated, and they’ll grow up and use their educations to find good jobs. Maybe they won’t need vouchers to pay the rent once they’re out on their own. Maybe they’ll invite you over for birthdays and holidays to laugh and argue and turn up the music at their homes… A voucher, in short, is your chance to break the generational cycle of poverty; it’s how you’ll do that quintessentially American thing we call picking yourself (and your family) up by the bootstraps.
But when landlords hear you say “voucher,” they imagine something quite different. To them, a voucher means the government is involved and inspections have to been done. In reality, government involvement means that the majority of each monthly rent payment will be guaranteed, and inspections require little more than basics such as hot and cold running water and working lights. But maybe you’ll be too loud, too messy, have too many people over, or damage property. What if the neighbors complain? Vouchers mean you’re poor, right? Surely that comes with all kinds of problems…
As a result, you have no opportunity to prove that you’ll be a good tenant, no chance to settle in and build relationships with the neighbors. Your money is no good here. Voucher holders need not apply.
A recent report by the Housing Research & Advocacy Center notes that voucher holders in Cuyahoga County, Ohio consider finding a neighborhood with a low crime rate to be their top priority when searching for housing. Yet nearly 90 percent will end up clustered into racially-segregated areas with high poverty, high crime, low educational opportunities, and prevalent environmental health hazards.
What do voucher holders identify as their greatest challenge? Landlords refusing to accept vouchers. This is no anomaly. All over the country studies are revealing a widespread refusal to accept vouchers. It’s happening legally in cities like Pittsburgh, and it’s happening illegally in cities like New York City and Seattle.
Improving federal fair housing law to bar discrimination based on source of income — and making clear that this includes vouchers — is a critical step towards equitable housing access for families with small incomes. Municipal and state-level ordinances are important, too. But fair housing laws only work if renters and landlords know about the laws and the laws are enforced. Federal protections mean access to the resources and mechanisms necessary for awareness and enforcement.
Census Report Shows Progress for Those Who Need It Most
U.S. Census data for 2015 showed decisive progress in three measures of well-being: Poverty fell; median household incomes rose; and health-care coverage expanded. Using data going back to 1988, last year was only the second time on record — and the first since 1999 — that all three measures improved.
These indicators reflect a tightening job market that’s led to increased wages; policy changes, including minimum wage increases in several states, counties, and cities, that have further boosted workers’ earnings; and health reform’s continued impact on health coverage, as the national uninsured rate fell below 10 percent for the first time on record.
One of the most encouraging takeaways from the 2015 data is that the gains of the recovery from the Great Recession are starting to reach low- and middle-income people. Jobs and real average weekly earnings rose at their fastest pace in more than 15 years, giving a needed boost to workers at the bottom of the income scale.
The Census data highlight the gains workers see as the economy approaches full employment. Incomes grew fastest in the bottom and middle of the income spectrum, rising 7.9 percent in real (i.e., inflation-adjusted) terms for households at the 10th income percentile and 5.2 percent for households at the 50th percentile, compared to 2.9 percent for those at the 90th percentile.
The data also show progress on poverty: The official poverty rate fell from 14.8 percent in 2014 to 13.5 percent in 2015. Of particular note, the poverty rate for female-headed households with children declined by 3.3 percentage points, from 39.8 percent in 2014 to 36.5 percent in 2015, the largest decline since 1966. The safety net continued to play a large role in reducing poverty in 2015. Safety-net programs cut the poverty rate nearly in half last year, lifting 38 million people — including 8 million children — above the poverty line. The Census data show the impact of a broad range of government assistance, such as Social Security, SNAP (formerly food stamps), and tax credits for working families such as the Earned Income Tax Credit and Child Tax Credit. The figures rebut claims that government programs do little to reduce poverty.
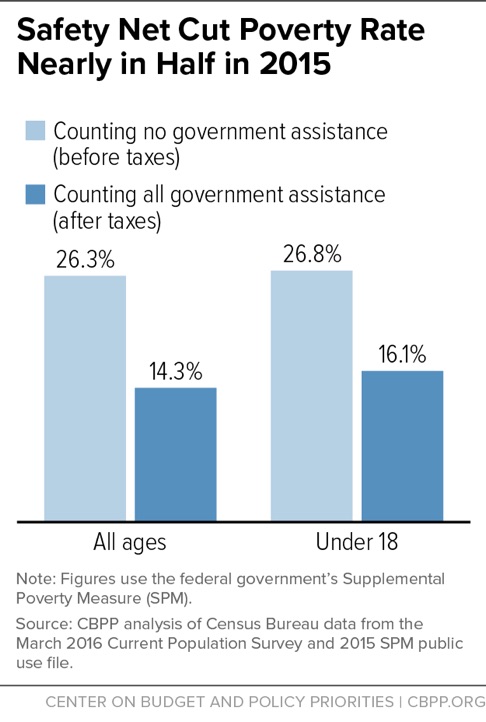
Government benefits and taxes cut the poverty rate from 26.3 percent to 14.3 percent in 2015. Safety-net programs cut poverty significantly across all age and racial/ethnic groups the Census data cover. For example, they lifted 23.3 million white non-Hispanics, 6.1 million black non-Hispanics, 6.7 million Hispanics, and 800,000 Asians above the poverty line in 2015.
However, despite the progress displayed by the 2015 data, the poverty rate remained higher in 2015 than in 2007. Some 43 million people were poor last year by the official poverty measure.
To continue this progress and eventually recoup the recession’s losses, policymakers should work to keep wages rising for workers by increasing the minimum wage at both the state and federal levels and implementing the new federal rule that makes more salaried workers eligible for overtime pay.
Policymakers should also seek common ground on measures to reduce poverty. Examples include strengthening the inadequate Earned Income Tax Credit for low-income childless workers, as both President Obama and House Speaker Paul Ryan have proposed; strengthening the Child Tax Credit for children in the poorest families, especially those with young children; and increasing the supply of rental vouchers and enabling more low-income households with vouchers to live in neighborhoods with lower poverty, better schools, and more job opportunities. Strengthening the safety net is a crucial investment in America’s children; a growing body of research indicates that low-income children who receive safety-net assistance tend to do better in school, are healthier, and have greater earning power when they grow up.
As the American Academy of Pediatrics recently explained, “When a family lacks access to steady income, stable housing, adequate nutrition, and social and emotional support, it threatens the future of children and undermines the security of the nation as a whole.” Using the progress in the 2015 Census data as a guide, policymakers should continue to pursue policies that reduce poverty, promote job and wage growth, and extend health coverage.
New Driverless Car Rules Will Stifle Innovation, Cost Lives
Three numbers: 35,200 people were killed in auto accidents last year; 94 percent of car crashes are due to human error; 613,501 lives have been saved by advances in auto safety over the past 50 years. These numbers form the basis of the National Highway Traffic Safety Administration head’s argument for autonomous vehicles and a friendly regulatory environment.
Ironically, though, the National Highway Traffic Safety Administration (NHTSA) is also considering premarket approval and post-sale regulations that would restrict the development and improvement of autonomous vehicles even more than “dumb” vehicles, potentially leading to the unnecessary loss of life.
In a speech on Monday at the Automated Vehicles Symposium in San Francisco, NHTSA Administrator Mark Rosekind said that his agency’s goal is to create “a framework that will speed the development and deployment of technologies with significant lifesaving potential.” However, the very next day, his agency released the long-promised NHTSA guidelines for autonomous vehicles, proposing two new authorities that would do the exact opposite. These new authorities are only options, and the NHTSA is seeking public comment.
The first proposal, the “Considered New Authority” of premarket approval, would require manufacturers to have their models approved before hitting showrooms for sale — a departure from the current process of self-certification. A premarket approval process, the guidelines say, would help the public accept autonomous vehicles. However, this is a long-term solution to a short-term problem; and this new authority not only goes against Rosekind’s own expressed approach but also the way automobiles are made.
“If we wait for perfect, we’ll be waiting for a very, very long time,” Rosekind said of autonomous vehicle technology in general. “How many lives might we be losing while we wait?”
The problem is that approving every single model for every single manufacturer would be a monumental task — and a slow one. Do we really want an FDA-style premarket approval process when delays could cost lives? (Look what’s happened with EpiPens.)
Moreover, models don’t just change every 12 months. Toyota makes thousands of improvements to its manufacturing processes every year, and manufacturers regularly tweak and improve their models. Even the parts, themselves, come from thousands of suppliers, each of which should be free to improve. Given that autonomous vehicles rely on software, manufacturers need the capability to implement change swiftly up to the moment of release.
The NHTSA is also considering establishing an authority to regulate post-sale software updates and is even considering “new measures and tools” such as prerelease simulation. At the moment, companies like Tesla can send software updates through the airwaves — which it did a week ago, making over two hundred enhancements of varying importance. Rosekind saw this as a positive development since it means that safety can be continuously improved.
However, the need for up-to-the-minute updates not only illustrates why a premarket approval process for software would be unsound, but calls into question the wisdom of heavily regulating post-sale software enhancements. If the NHTSA decides to regulate post-sale updates, their regulations should come in the form of self-certifications and post-release assessments. A pre-release approval process for security updates makes no sense.
Rosekind was right when he said, “technology is changing so rapidly that any rule we write today would likely be woefully irrelevant by the time it took effect years later.” Let’s just hope that the actual regulations will reflect this reality.
If not, the NHTSA could undermine its own mission, and the highway death toll will remain at its current high levels.
Grant Broadhurst’s work has appeared in The American Spectator and Watchdog News. He graduated summa cum laude from the University of North Florida and is a Young Voices Advocate. Find him on Twitter: @GWBroadhurst
The Risks of Ignorance in Chemical and Radiation Regulation
The Nuclear Regulatory Commission sought comments last June on whether it should switch its default “dose-response model” for ionizing radiation from a linear no threshold model to a hormesis model. This highly technical debate may sound like it has nothing to do with the average American, but the Nuclear Regulatory Commission’s (NRC) decision on the matter could set the stage for a dramatic shift in the way health and environmental standards are set in the United States, with implications for everyone.
Regulators use dose-response models to explain how human health responds to exposure to environmental stressors like chemicals or radiation. These models are typically used to fill gaps where data is limited or non-existent. For example, analysts might have evidence about health effects in rodents that were exposed to very high doses of a chemical, but if they want to know what happens to humans at much lower exposure levels, there might not be much available information, for both practical and ethical reasons.
The linear no threshold (LNT) model has a tendency to overestimate risk because it assumes there’s no safe dose — or “threshold” — for an environmental stressor. (We discuss the LNT model in our new Mercatus Center research, “Regulating Under Uncertainty: Use of the Linear No Threshold Model in Chemical and Radiation Exposure.”) The response (cancer, in most cases) is assumed to be proportional to the dose at any level, even when exposure is just a single molecule. LNT is popular with regulators in part because of its conservative nature. When setting standards, the logic goes, better to be safe than sorry. That is, it’s better to assume that there is no threshold and be wrong than to assume a safe dose exists when one does not.
But does the use of the LNT model really produce the “conservative” results its proponents claim? There are very good reasons to doubt it.
The first is that there are no absolute choices; there are only tradeoffs. Regulations that address risk induce behavioral responses among the regulated. These responses carry risks of their own. For example, if a chemical is banned by a regulator, companies usually substitute another chemical in place of the banned one. Both the banned chemical and the substitute carry risks, but if risks are exaggerated by an unknown amount, then we remain ignorant of the safer option. And because LNT detects — by design — low-dose health risks in any substance where there is evidence of toxicity at high doses, businesses are led to use newer, not-yet-assessed chemicals.
Economic costs borne from complying with regulations also produce “risk tradeoffs.” Since compliance costs are ultimately passed on to individuals, lost income from regulations means less money to spend addressing risks privately. When their incomes fall, people forgo buying things such as home security systems, gym memberships, healthier food, new smoke detectors, or safer vehicles. And when regulators inflate publicly addressed risks but leave private risks unanalyzed, it becomes impossible to weigh the pros and cons of public versus private risk mitigation.
But the most compelling reason to doubt that LNT is a “conservative” standard is simply that it’s likely to be wrong in so many cases. The assumption that “any exposure” causes harm is contradicted not only by common sense, but by a growing body of research. In the decades since LNT was first adopted by regulatory agencies, more and more evidence supporting a threshold — or even a “hormetic” — model of dose response has been found.
Hormesis occurs when low doses of exposure actually cause beneficial health outcomes, and, coincidentally, the scientific evidence for hormesis appears strongest in the area where the LNT was first adopted before its use spread to other areas: radiation. For example, low-doses of radiation exposure have been shown to have protective effects against kidney damage in diabetic patients, and low doses of X-rays have been associated with an anti-inflammatory response to treat pneumonia. There is now evidence of hormesis in hundreds of experiments, but the LNT rules out — by assumption — the possibility of these kinds of beneficial health responses.
Unfortunately, the way regulators typically respond to these problems is simply by ignoring them. Hence a better moniker for the use of the LNT model might be “Ignorance Is Bliss.” So long as regulators ignore the inconvenient truths posed by the possibilities of hormesis and risk tradeoffs, they can continue going to work every day maintaining the belief they are protecting public health. But the uncertainty in their risk assessments is so great that, in fact, regulators often have no idea whether they’re improving public health or doing just the opposite.
A reconsideration of the LNT is long overdue. At the very least, risk analysts should characterize uncertainty using multiple-dose response models — including a threshold model or a hormetic model — when no model has the overwhelming support of the scientific evidence. And analyzing risk tradeoffs should be a routine part of rulemaking.
The NRC should be commended for acknowledging the doubts about the LNT. When the time comes for the agency’s decision, let’s hope they choose knowledge over ignorance.
The Texas Model: Lower Crime, Lower Recidivism
The classic Daniel Patrick Moynihan quote that “everyone is entitled to his own opinion, but not his own facts,” is an import maxim in public policy debates. This is doubly so in criminology, where billions of dollars, quality of life in communities, and — most importantly — the very safety of law-abiding citizens rest on policymakers getting it right.
But despite the facts, critics still maintain that Texas’ criminal-justice reforms have failed to reduce crime and recidivism. The reforms at issue began with a spate of legislation passed during the 80th Texas Legislature in 2007, including a sweeping reorganization of the state’s community correction system under HB 1678. Facing prison and jail capacity overruns with no space to house violent offenders, the legislature prioritized probation and parole for low-risk offenders. We’ve illustrated time and again that once these policies were in place, crime rates continued to fall in-tandem with these reforms, despite similar protests from critics of the day that the opposite would happen.
For instance, in a recent Real Clear Policy op-ed, Sean Kennedy argues that despite Texas’ reform efforts, the re-arrest rate for state prisons and state jails (a Texas-specific type of short-term state incarceration facility) has not changed significantly since 2004. Even assuming that re-arrest rates are a good measure of recidivism reduction, the problem with this argument is that the composition of the prison population before and after the reforms is importantly different. Why? The 2007 reforms focused only on nonviolent and low-level offenders. (See graphic.)

Texas’ 2007 criminal-justice reforms shifted many non-violent offenders away from incarceration while increasing resources for proven rehabilitation programs and supervision, such as probation officers, resulting in improved public safety.
It’s almost a cliché that limited prison capacity should be reserved for “those who we’re afraid of, not for those we are mad at,” prioritizing bed space for violent or high-risk offenders. This was not the case in Texas prior to 2007, when only 22 percent of the admissions to state facilities for violent, property, and drug offenses were violent offenders. In 2015, this number grew to 27 percent, meaning that the prison composition on net became far more criminogenic. In fact, contrasting admissions from the two years, the only population that grew in raw terms was violent offenders.
Was this because Texas was suddenly beset with bands of violent super-predators marauding the state after having been given lenient sentences? Clearly not. Texas’ 2007 reforms didn’t address violent crimes. But had we kept the status quo, we would have likely not have had the space to house new offenders. On pace, we would have been 11,464 over operational capacity by 2010. (“Operational” capacity, not design capacity, means milking every last square foot of residential space in a facility.) Texas’ state beds now hold a greater number of violent offenders than they did before the reforms.
The bottom line is that Texas has successfully focused criminal-justice resources on violent offenders while diverting non-violent offenders — whenever appropriate — to alternatives to incarceration. The data show that the non-violent offenders who received probation or who were diverted to rehabilitation programs are now less likely to reoffend than before when they were housed with violent offenders in the general prison population. Texas’ criminal-justice reforms have made Texas safer. They are — and should remain — a model for the rest of the nation.