The Submerged Welfare State

(CC Image/Flickr user Cameron Grant)
Scientists seeking the secrets of invisibility would do well to talk to Congress.
According to a report released on May 29 by the Congressional Budget Office (CBO), the vagaries of the U.S. tax code obscure upwards of $1 trillion in government spending. Affectionately known as breaks or loopholes, these "tax expenditures" overwhelmingly benefit the richest Americans - at the expense of everyone else.
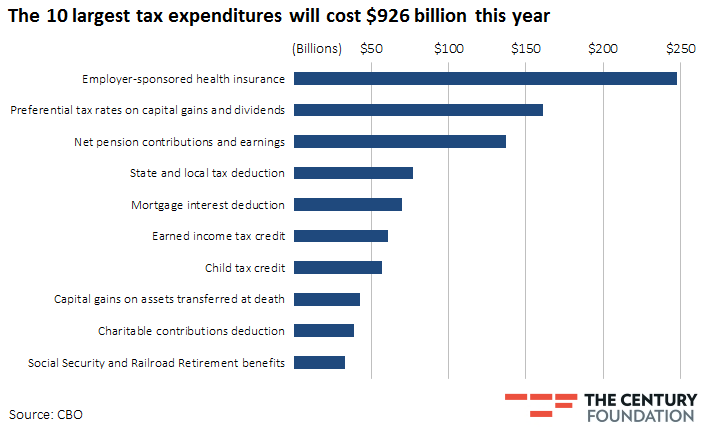
The ten largest loopholes - things like employer-sponsored health insurance exclusions, mortgage interest deductions, and preferential rates on investments - account for the lion's share of tax expenditures, or $926 billion annually.

Of course, controversy over tax breaks isn’t new. But the numbers are staggering. To get a sense of the scale of these invisible expenditures, consider:
- The $926 billion the government will spend on the 10 largest tax expenditures in 2013 equals one-third of projected government revenues. In other words, current tax collections are roughly three-quarters of their potential in the absence of these loopholes.
- Taken together with traditional government spending, the top-10 tax expenditures represent more than a fifth of total outlays.
- Without the top-10 tax expenditures, America’s projected $642 billion deficit for 2013 would be a nearly $300 billion surplus. (As the report notes, the amount of revenue collected if the tax breaks were eliminated would be somewhat less than the tax expenditures, because people would change their behavior in the absence of incentives. But you get the point.)
- The U.S. spends 1.5 times more on tax expenditures than it does on all non-defense discretionary spending.
- The $11.6 trillion CBO projects the U.S. will spend on tax expenditures during the next decade is nearly twice CBO’s projected budget deficit during the next decade. That is, without tax expenditures, a $6.3 trillion increase in the national debt during the next 10 years would be a surplus of nearly equal magnitude.
Were it strictly a matter of accounting, tax expenditures - which consist of exclusions, deductions, credits, and preferential tax rates - wouldn't be so problematic. From a government budget perspective, one less tax dollar collected is the same as one more dollar of spending. The issue is that tax expenditures fall outside the annual appropriations process and are largely hidden from public view. After all, it's much more difficult to track a dollar that wasn't spent than one that was. With lack of transparency comes a lack of control.
The consequences are not innocuous. Every dollar that isn't collected in taxes means one less dollar available to spend on all the other services citizens expect from government. Viewed another way, for any given level of desired government spending, every tax expenditure necessitates an increase in the general level of taxation. If you're not getting a break, you're paying more.
And what CBO's data shows is that the winners are the rich and the losers are the poor. Arithmetically, this makes sense. The more income you have, or the higher your tax bracket, the more you stand to gain from tax breaks.
But as a matter of policy, one would be hard-pressed to find a more systematically regressive set of spending priorities. Fully 51 percent, or $473 billion, of top-10 tax expenditures are spent on households with incomes in the top quintile. A stunning 17 percent goes to the top 1 percent (singles with incomes above $327,000 and couples making more than $463,000). Call it welfare for the wealthy.
Of the top-10 tax expenditures, seven accrue disproportionately to the wealthiest households. The top income quintile receives:
- 93 percent of spending on preferential tax rates for capital gains and dividends ($78 billion).
- 84 percent of spending on charitable contribution deductions ($33 billion).
- 80 percent of spending on state and local tax deductions ($64 billion).
- 73 percent of spending on mortgage interest deductions ($51 billion).
- 66 percent of spending on exclusions for pension contributions ($92 billion).
- 65 percent of spending on exclusions for capital gains transferred at death ($31 billion).
- 34 percent of spending on exclusions for employer-sponsored health insurance ($88 billion).
Tax expenditures are one of the largest contributors to America's growing inequality. They are why Warren Buffet pays less in taxes than his secretary. And they may well explain why Mitt Romney isn't president. For example, the government spends:
- as much on exempting employer-sponsored health insurance from taxes ($248 billion) as it does on Medicaid ($265 billion).
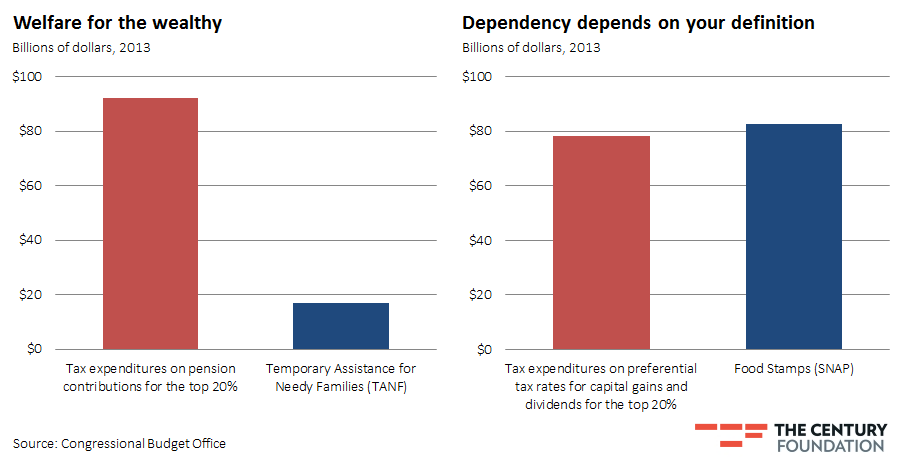
- as much on preferential tax rates for capital gains and dividend income for the top quintile ($78 billion) as it does on Food Stamps ($83 billion)
- more than five times as much on encouraging the wealthy to save for retirement ($92 billion) as it does on cash welfare for the poorest Americans ($17 billion).

The typical justification for tax expenditures is that they promote socially valuable behaviors, like home ownership or obtaining health care. But the evidence as to whether they actually accomplish these objectives is far from conclusive. As Richard Thaler and Cass Sunstein famously document in Nudge, enrollment in retirement plans is alarmingly low, despite the tax advantages. Shockingly, this holds even among workers older than 59½, for whom employer contribution and penalty-free withdrawals offer an obvious arbitrage opportunity.
Quite to the contrary, tax incentives may distort economic behavior in undesirable ways. Academics at Stanford and Columbia say tax expenditures on employer-sponsored health insurance are one of the key causes of America’s vast health spending. Because of the tax advantages, people consume more health care than they otherwise would, driving costs. Generous coverage also creates moral hazard: people can afford to take more health risks because they’ll bear fewer of the consequences.
In a similar vein, research at Harvard and the Tax Policy Center find that the mortgage interest deduction does little to increase home ownership. Given our particular place in economic history, another fair question to ask is: Does America really need to be investing any more in mortgages? And while we’re on the topic of the recent excesses of the financial sector, it’s appropriate to note that there is scant evidence favorable tax rates on capital gains actually do all that much to affect aggregate economic growth. Unless, of course, that growth is in the wallets of the top 1 percent.
In essence, tax expenditures are the government’s version of magazine subscriptions. Someone at some point thought each a good investment and over time, we’ve come to accumulate a bizarre and confusing pile of unread periodicals. Each year, our collective subscription is automatically renewed – and often expanded – and we pay little notice. In the process, everything else gets squeezed. Those hurt most are those who can’t afford the subscriptions in the first place.
Sadly, this state of affairs is not confined to tax breaks for the wealthy. More and more, major government programs and activities operate outside the public spotlight, free from scrutiny and immune from oversight. As TCF fellow Suzanne Mettler documents in The Submerged State, the amazing disappearing government is anything but magical. The less Americans know about the more government does, the worse our democracy fares.
Invisibility may be far in the future. But for now, it’s time we shed more light on America’s shadow welfare state.
[Author’s Note: Unless otherwise noted, all data in this blog post comes from CBO: The Distribution of Major Tax Expenditures in the Individual Income Tax System (May 29, 2013), Updated Budget Projections: Fiscal Years 2013 to 2023 (May 14, 2013), The Budget and Economic Outlook: Fiscal Years 2013 to 2023 (February 5, 2013), and OMB: The President's Budget for Fiscal Year 2014.]


