
Why Federal Regulation Hits Red States Harder

We recently released a study estimating the impact of federal regulations on each state, called the "Federal Regulation and State Enterprise" (FRASE) index, and as part of this study, we included the heatmap below. The heatmap shows states where the impact of regulation is higher than the national average shaded in "hot" colors — different shades of orange — and states with impacts lower than the national average shaded in "cool" colors — variations of blue.
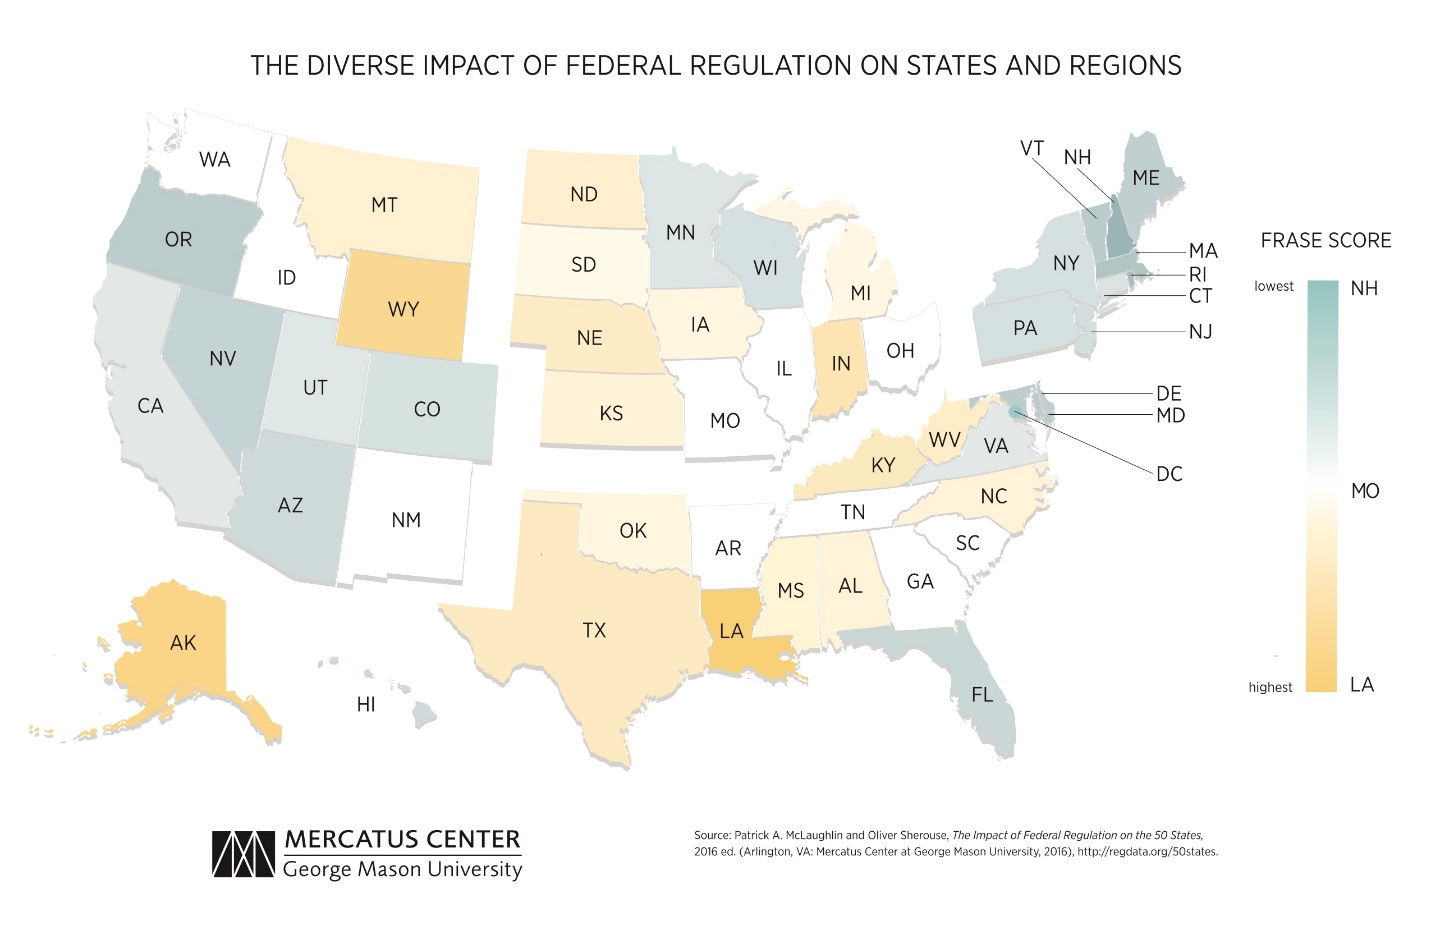
Keen observers immediately noticed a pattern: Many "red states" — traditional Republican strongholds — are also red (or orangish) on the heatmap. Likewise, many "blue states" are blue on the heatmap. These observers' eyes didn't deceive them: There is a strong correlation (0.62) between the percentage of voters in each state who chose the Republican candidate in the 2012 presidential election and the 2012 score for the FRASE index.
Is this coincidence? Why are red states red in our heatmap, and why are blue states blue? Our index is completely data-driven, and two factors explain much of this pattern: the specialization of a state in one or a few industries and the growing importance of environmental regulations.
The two essential inputs for the FRASE index are estimations of how much federal regulation is applicable to each industry, and the importance of each industry to each state's economy.
The first element — industry regulation levels — comes from the RegData project. RegData is both a methodology and a database, and it involves the use of computer programs to read hundreds of thousands of pages of federal regulations and produce statistics about the text. The two statistics from RegData that we use are the number of regulatory restrictions (words like "shall" or "must") and the probability that those restrictions are relevant to each industry in the economy. This lets us estimate the number of restrictions relevant to each industry in each year. We use this as a measurement of how regulated different industries are.
The second element is the importance of each industry to each state, relative to the industry's importance to the nation overall. For this, using data from the Bureau of Economic Analysis, we calculated the percentage of each state's economy that is produced by each industry, and then divided those numbers by the comparable national figures.
As a result, when a state economy is highly concentrated in one or two industries, changes in regulation on those industries can dramatically affect the state's score on the index. Some trends in the production of regulations — such as the growth of environmental and transportation regulations — play a large role in determining the levels of regulation on specific states.
For example, the Environmental Protection Agency was responsible for about 7 percent of the regulatory restrictions in existence in 1990. By 2013, that number had more than doubled, to about 15 percent. Other regulators, such as the Department of Transportation and the Department of Energy, increasingly address environmental issues as well. This trend is corroborated by trends in regulation by industry: Five of the 10 industries that experienced the largest increases in regulation since 1997 are particularly affected by environmental regulations.
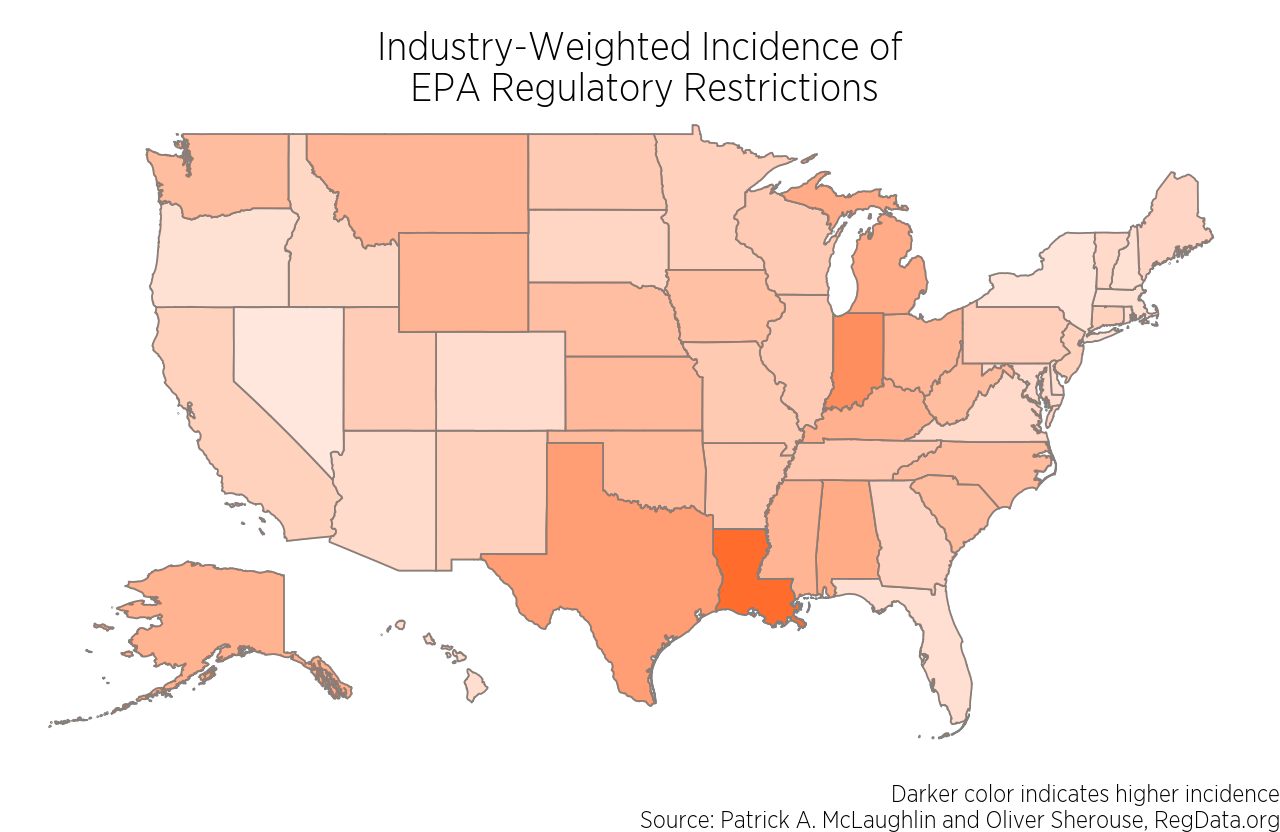
States with high FRASE index scores tend to be relatively specialized in industries that are heavily targeted by regulation — often in the form of environmental regulations. It's not surprising that these states are not randomly distributed throughout the country; economies everywhere often develop around the resources at their geographic disposal. Farming is more likely to be an important industry where there is fertile, flat land. Tourism, and the associated retail trade that goes with it, is more likely to be important where there are sunny beaches or snowy mountains. In general, industries form where inputs of production are cheap relative to the prices of their products. Forces of geology and geography happened to distribute some inputs of production unevenly across the states, and some of those inputs are important to industries covered in regulators' missions.
But why does this correlate with states' political leanings? Do the different impacts of federal regulations on the states affect the political inclinations of voters? It's a plausible hypothesis, but one that is well beyond the scope of our study or this essay. And politics certainly was not a factor in the construction of our data.
For our part, we have made our dataset freely available in the hopes that others might use our measurements of federal regulation to empirically assess their ideas. Over 130 years ago, the Nobel laureate and physicist Heike Kamerlingh Onnes elegantly summed his approach to science: "Through measurement to knowledge." We share the sentiment, as well as our measurements.
Patrick A. McLaughlin is a senior research fellow with the Mercatus Center at George Mason University. Oliver Sherouse is a research analyst for the regulatory studies program at the Mercatus Center.