
The Shape of the Obamacare Subsidy Curve

In its recent report addressing the employment-reducing effects of Obamacare, the CBO notes that the law's premium subsidies decline as a person's income increases. As I've mentioned on this blog before, cutting benefits this way functions as a tax -- it reduces the amount of money people gain by working, and thus discourages work. Even before Obamacare the poor paid exceptionally high tax rates when declining benefits were taken into consideration -- up to 95 percent, meaning they lost 95 cents of every extra dollar they earned.
Enter Obamacare. For people between 100 and 400 percent of the federal poverty level, the law guarantees that premiums for certain plans won't exceed a percentage of income, and that percentage increases as income increases. Here's a graph the Congressional Research Service released last year:
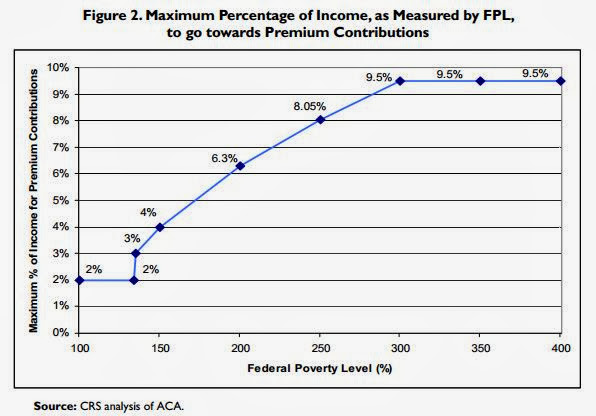
Basically, the same plan that would cost 2 percent of your income at the poverty level ($11,490 for an individual and $23,550 for a family of four in 2013) can cost up to 4 percent of your income at 150 percent -- the price can double in percentage terms and triple as a dollar amount. The cost continues to increase until it hits a cap of 9.5 percent of your income at 300 percent of poverty.
Then, at 400 percent of poverty (which, to be fair, for a family of four is well above the median U.S. income), you hit a cliff and the cap disappears completely. Here it's actually possible to lose a lot of money by working more.
In addition to premium caps, the law subsidizes cost-sharing -- and, as the CBO says, these subsidies drop "sharply at 150 percent, 200 percent, and 250 percent of the FPL."
Viewed in isolation, these incentives might not be the end of the world. But they're certainly not helpful when layered on top of everything else we do to discourage the poor from climbing the ladder.
Robert VerBruggen is editor of RealClearPolicy. Twitter: @RAVerBruggen