
The Distribution of Internet Usage

The FCC has decided to push forward with net neutrality (see our update today for two perspectives). This means that, assuming the decision holds up, Internet-service providers will no longer be able to charge companies like Netflix for higher speeds.
The fear is that, absent regulations, ISPs will abuse this privilege, extorting Internet businesses and blocking services that compete with products the ISPs offer. Others counter that "fast lanes" are actually the most user-friendly way of addressing the fact that some customers use a whole lot more Internet service than others. Charging based on usage directly, or cutting speeds for the heaviest users after they hit a bandwidth cap, makes people think twice every time they click a cat video -- maybe it's best if people who sign up for bandwidth-heavy services like Netflix pay for their usage when they pay their bills to those companies, rather than their Internet bills.
Without taking sides, it's worth putting some hard numbers on the light-vs.-heavy-user problem. Here's a chart from a 2014 report by the networking-equipment company Sandvine. Along the X axis, North American Internet subscribers are ranked from heaviest to lightest, and the Y axis shows their cumulative share of traffic. "Upstream" refers to data sent from the customer to someone else (e.g. outgoing e-mails); "downstream" refers to data that flows to the user's computer (e.g. websites and streaming media). For individual customers, as opposed to businesses like Netflix, most data flows downstream, as seen in the fact that the downstream and aggregate numbers are basically the same.
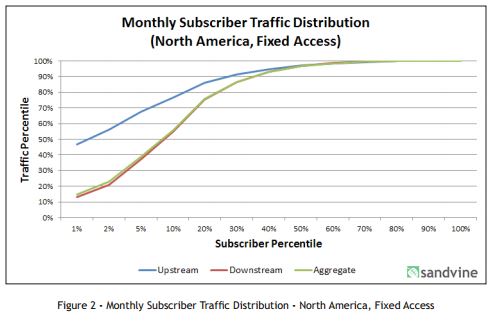
Half of users account for more than 95 percent of traffic.
Later in the report, the company breaks users into three groups: Heavy users of media (who may have "cut the cord" and canceled their cable, replacing it with Internet streaming), moderate users, and light users. The heavy users, the top 15 percent when it comes to audio and video streaming, use a mean of 212 GB per month total. Almost three-quarters of this traffic is specifically for streaming, which they spend an estimated average of 100 hours per month doing. The bottom 15 percent of media streamers use, on average, less than 5 GB per month. And the 70 percent of users who fall in the middle use 29 GB per month. Almost half of their traffic is for streaming, despite the fact they spend only 9 hours a month doing it.
Robert VerBruggen is editor of RealClearPolicy. Twitter: @RAVerBruggen