
When Crime Guns Cross State Lines

On Friday, the New York Times released a big analysis of interstate gun trafficking, based on gun-trace data from the Bureau of Alcohol, Tobacco, Firearms and Explosives. It's a good read, and the lead graphic — a map of the U.S. showing how crime guns move from states with lax gun laws to states with strict ones — is especially neat.
As the story came out, I was in the process of crunching the numbers myself, but with a focus on several other variables. State gun laws do seem to affect the flow of weapons, which is important as we debate the merits of stricter federal laws. But other factors also play a strong role and complicate the picture. To a certain extent, crime guns simply come from states with lots of guns, and are found at crime scenes in states with lots of crime scenes.
Here, for example, is the relationship between crime-gun exports and gun-ownership rates — with the states color-coded to reflect whether they require background checks for private handgun sales, the restriction that seems most likely to affect trafficking. (See the note at the end for the gory data details. Short version of the biggest limitation: I rely on a gun-ownership survey from 2004 because it's the best available; the results don't change much if you swap in newer but less precise measures.)
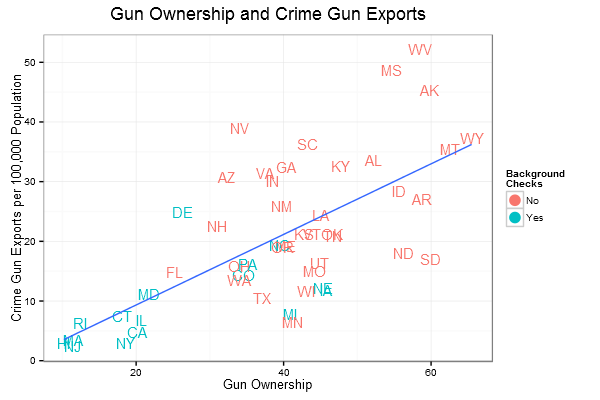
There's a cluster of states with low ownership, background checks on private handgun sales (and often other gun laws), and low exports, making it hard to say whether the low ownership or the laws should get credit for the low exports. But among the states with higher ownership, Delaware aside, the background-check states do seem to have pretty low export rates.
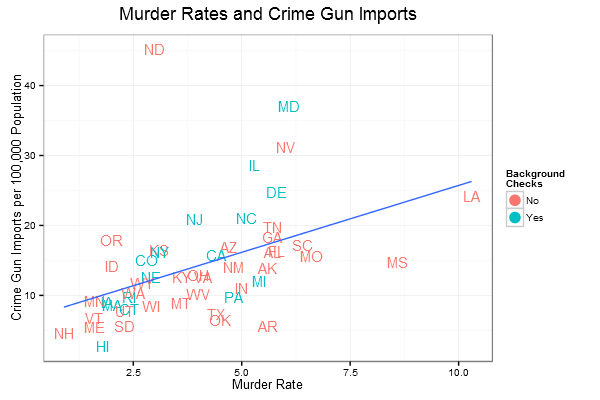
And here is the connection between murder rates and crime-gun imports. The result isn't surprising; not only does more crime translate to more crime-gun traces, but high-crime states are more likely to have organized gangs to traffic weapons. Here the trend with background checks is less clear, but states that couple moderate-to-high crime with background checks often have serious gun-trafficking problems.
We can get a different look at the import question by analyzing the percentage of traced guns in each state that are imported. With this measure, a relationship with gun ownership emerges, though it takes an interesting shape.
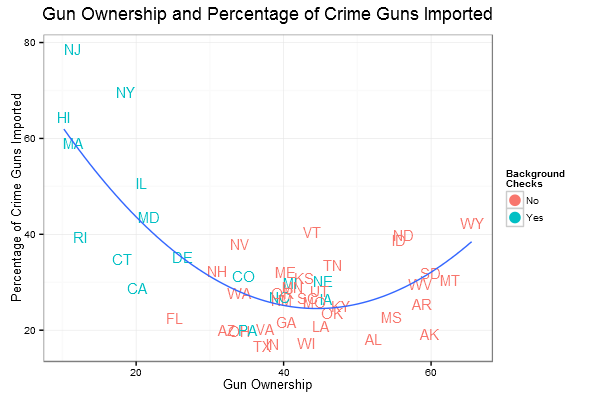
We again face the frustrating fact that all the states with low gun ownership also have background checks on private handgun sales, but it's hard to look at the left-hand side of this chart and not think policy plays a role in the trend. Also, an interesting test case is Missouri, which has high gun ownership and repealed its permit-to-purchase law in 2007. As the Times notes, since then, the proportion of crime guns coming from inside the state has risen, from less than 60 percent to almost 75 percent. And here's a more complicated analysis of trafficking (albeit from a group of anti-gun public-health researchers) that tries to account for geography and more types of state gun laws; it also finds that background checks make a difference.
So, background checks seem to work — at least in the sense of forcing criminals to turn elsewhere — even if they're far from the only driver of gun trafficking. The big question is what would happen if we required these checks nationwide. Would some criminals fail to get guns entirely? Or would they come up with some new evasion strategy?
Robert VerBruggen is editor of RealClearPolicy. Twitter: @RAVerBruggen
Notes: I started with the ATF's trace numbers for 2014 (which admittedly are not comprehensive because not all crime guns are traced) and calculated per capita rates with Census data. Murder rates are from the FBI. For background checks, I used this list from the anti-gun group Everytown, but I didn't include Washington because its law didn't go into effect until toward the end of 2014. For the record, there's also a case to be made that Minnesota, whose policy is incredibly convoluted, should be considered a background-check state.
The gun-ownership numbers come from a 2004 survey by the Centers for Disease Control. The same question was asked in 2001 and 2002 as well, with remarkably stable results. For Hawaii, whose 2004 data point is missing, I used the 2002 number instead — though gun ownership seems to have risen quite a bit in the state since then, and obviously as an island it's not the best state to be dwelling on in terms of gun trafficking.
There's also a 2013 survey from YouGov, but frankly I find several of the numbers suspect. It's unlikely that Massachusetts has a far higher rate than New Hampshire, and I doubt Hawaii's rate has risen all the way to 45 percent from about 10 percent in the in the 2001 and 2002 CDC surveys. Some researchers also use the percentage of suicides committed with a gun as a proxy for gun ownership, but there are various issues with this. My spreadsheet includes the other two ownership measures if you'd like to experiment (suicide data from 2013, the most recent I could find from the CDC). The picture presented above stays pretty consistent when you use the other measures anyhow.
You can see my spreadsheet here and my R code here. The R code also includes some statistical models I experimented with. (Standard disclaimer: I'm a journalism major, so the fancy models are just me playing around. Please let me know if you have ideas for me.)